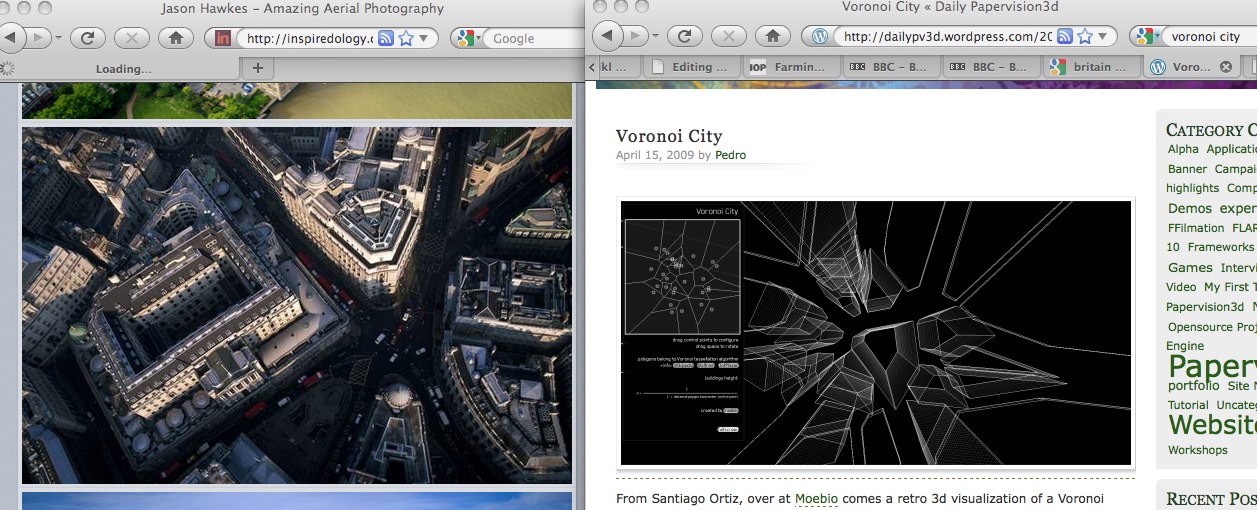
Voronoi Diagram
In 1854, the physician John Snow used a Voronoi diagram to illustrate how most of the people who died in the Soho Cholera outbreak lived closer to the Broad Street pump than any other water pump and used this to persuade authorities to remove the handle of the pump to prevent more infections.
Basically, Voronoi Diagrams/Thiessen Polygons can be used to describe the influence of a point. The shapes formed are sometimes called Thiessen polygons; there are very many names for this useful concept because they were discovered independently across different disciplines, and have been used in geography, geophysics, and meteorology to estimate the influence of catchment areas or watersheds.
http://inspiredology.com/jason-hawkes-amazing-aerial-photography/ http://dailypv3d.wordpress.com/2009/04/15/voronoi-city/
